|
Challenge Smackdown Headquarters

Map per map analysis - Jjonez - 08/08/01
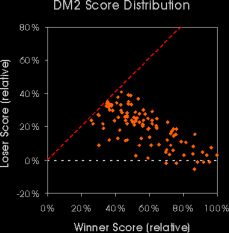
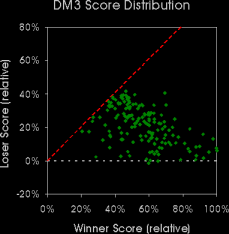
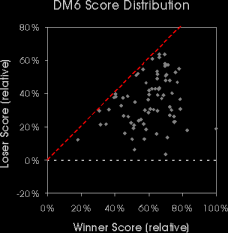
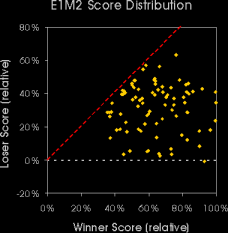
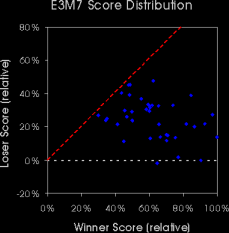
The following graphs could probably us a few words of explanation. In each graph, the scores of the teams on one map are plotted relative to the maximum score one team attained on that map. The winners score is on the horizontal axis, while the corresponding loser score can be found in the vertical direction. For example, the highest score of any team winning E1M2 was 306. The dot for this game is on the right extreme of the graph, in this case at a height of 34%, since the losing team in that particular game had a score of 106.
The red line in each graph shows where a game with winner and loser scoring equal would be. Obviously, no games can end up above the red line, and not even exactly on the line, due to the overtime rule (i.e. all rounds have to be won with 1 frag difference at the least).
Rounds near to the red line are very close games, at least score wise. They could have been very chaotic, with neither team having control over the level or games where one team was in control most of the time, but the other managed to mount a come-back in the final minutes. That's of course impossible to tell from these figures.
Round situated near this horizontal axis (dashed horizontal line) were total blowouts, where one team barely manages to score at all, if it even stays in the positive half-plane.
Armed with this knowledge about how the data is presented, we can now try to interpret the results for each map.
DM2
We start of with DM2, and it might well be the most interesting graph of all. If we understand this one, the others will be easy to interpret.
For starters, it's clear that a few games ended with one team having negative overall frags. This can easily be attributed to the abundance of lava on the level. If one team manages to take control of the map right from the start and denies the enemy all rocketlaunchers, these will have a hard time making up for the few accidental dips.
Besides those negative scores, not too many other results are around the horizontal axis. This means the blowout potential of DM2 is in fact rather limited. Quite a few games are close to the red diagonal on the other hand; many rounds ended with very close scores.
The most interesting feature of the DM2 graph is related to the other diagonal however. Although not explicitely indicated on the figure, you can imagine where it should be by connecting all points on the top and to the right. Scores on this line have one thing in common: their total frag count. Apparently for DM2, there is a maximum total amount of frags that can be made within the 20 minute period. This is not very easy to explain, but it basically means 'frag or be fragged'. The frag rate is not excessively high however (compared to DM6 at least), and this can be attributed to the size of the level or rather to the fact that a few spawn spots are a bit out of the way and/or have easy access to armors. This extends the average lifetime of the Quake marine a bit. On the other hand, there is not much opportunity to hide in the level either. You might be able to stay in the double yellow armor area for a while without being noticed, but even that is usually swept clean regularly by Quad runs.
DM3
The graph for DM3 appears rather similar to that of DM2. Negative scores are more rare and the upper total frag limit is far less pronounced, with scores scattered over a wider area in the right portion of the graph. The reason for that is probably the larger size of the level: the losing team can influence the winning teams score significantly for example by either hiding in the super nailgun area or rushing like crazy.
DM6
DM6 shows a quite different image. Blowouts are very uncommon on this map. In fact, for the whole horizontal scale, results can be found very close to the red diagonal. This means close games can happen in slow scoring games as well as in games where the frag rate is very high. There is no clear evidence of a frag ceiling being hit yet, which is interesting because almost all spawn points in this level can be covered simultaneously by a team that is in control. Apparently its not easy to frag faster then the enemy spawns.
E1M2
In some ways, the E1M2 graph is similar to DM2 and DM3 and in others it resembles DM6 more.
Of all maps, this one has the most even distribution of the results in the lower right area of the graph. There are many close games, but just as many blowouts. The amount of games near the right edge of the map is higher then anywhere else. It seems that the losing team can score relatively high, whatever the winning teams result.
E3M7
Except for pointing out the few negative scores (likely due to lava aided by tight corridors here), there is little analysis the graph allows to do. The number of rounds played on E3M7 (only 40) appears too small to let any trends show trough.
|