|
Challenge Smackdown Headquarters

Blowouts and close games - Jjonez - 08/08/01
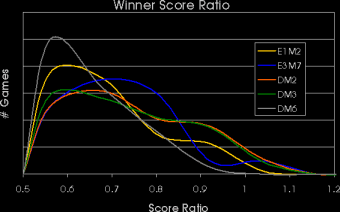
The best way to find out how likely a map is going to result in a close game is to look at the follwing figure.
This is again a histogram, but this time of the relative amount of frags the winning team managed to make during the round. For example, if winner and loser score equal, the score ratio of the winner would be 0.5 (which is impossible due to overtime rules). If the winner makes all the frags and the losing team manage a score of zero, the the score ratio of the winner would be 1. In case the losing team doesn't even manage to keep a positive result on the board, the ratio can even be over 1.
As we already saw in when discussing individual maps, the scores on DM6 are often very close. This results in the high peak of the gray curve near 0.5.
Like we noticed earlier also, DM2 and DM3 have a similar distribution of relative winner and loser frags. This results in nearly identical curves on this graph. Very close rounds on these maps are fairly rare, and the peaks around 1 indicate that many times the winning team makes nearly all frags or actually pushes the losing team into the negatives.
The trace for E1M2 lies in between the others. This was already apparent from its score distribution with the whole area below the red line being occupied pretty evenly.
|